
Opens ChatGPT with this case study pre-loaded. No signup required on our site.
About the Brand
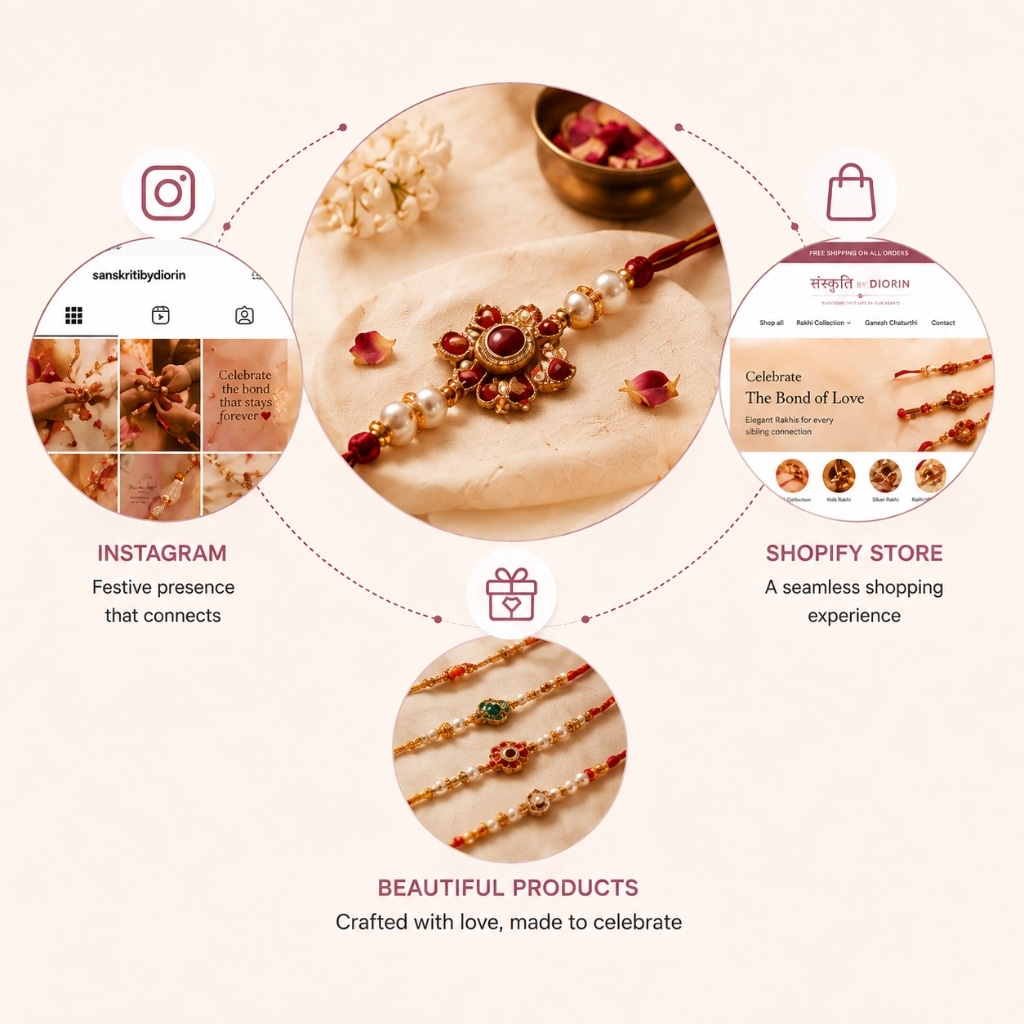
Diorin already had a well-known jewellery business with loyal customers. When Raksha Bandhan season came close, the team wanted to make the most of it. So they built a brand-new store — just for rakhis and festive gifting — separate from the main jewellery catalogue. They called it Rakhi By Diorin.
The plan going in was simple:
- Set up a clean Shopify store
- Make sure the journey from landing page → product page → cart → checkout felt smooth
- Add analytics so they could actually see how visitors were behaving
- Use Microsoft Clarity to watch real-time visitor activity
- Once the store was ready, start driving traffic through Instagram and Meta ads with strong festive creatives — since the festive window was short and time was tight
This gave them a solid store. But having a good-looking store isn't the same as having a store that sells.
What We Noticed
Once traffic started coming in, a pattern showed up quickly: people were visiting the store, but very few were buying.
A few things stood out immediately:
- Low add-to-cart ratio: Visitors were browsing multiple pages but not adding products to their cart — the ratio was far too low.
- High checkout abandonment: Even the people who did add something to their cart were leaving before completing checkout.
- Lack of product-level visibility: There was no clear visibility into which rakhi products people actually liked, which ones they skipped, or exactly where in the journey they were dropping off.
- Untested assumptions: Product selection, pricing, and offers had all been set up early on, but none of it had been tested with real shopper behavior — so any change made without evidence would be a blind guess.
Guessing during a festive season that lasts only a few weeks is expensive. Get it wrong, and there's no time left to recover before the season ends.
What We Did: The Research Process
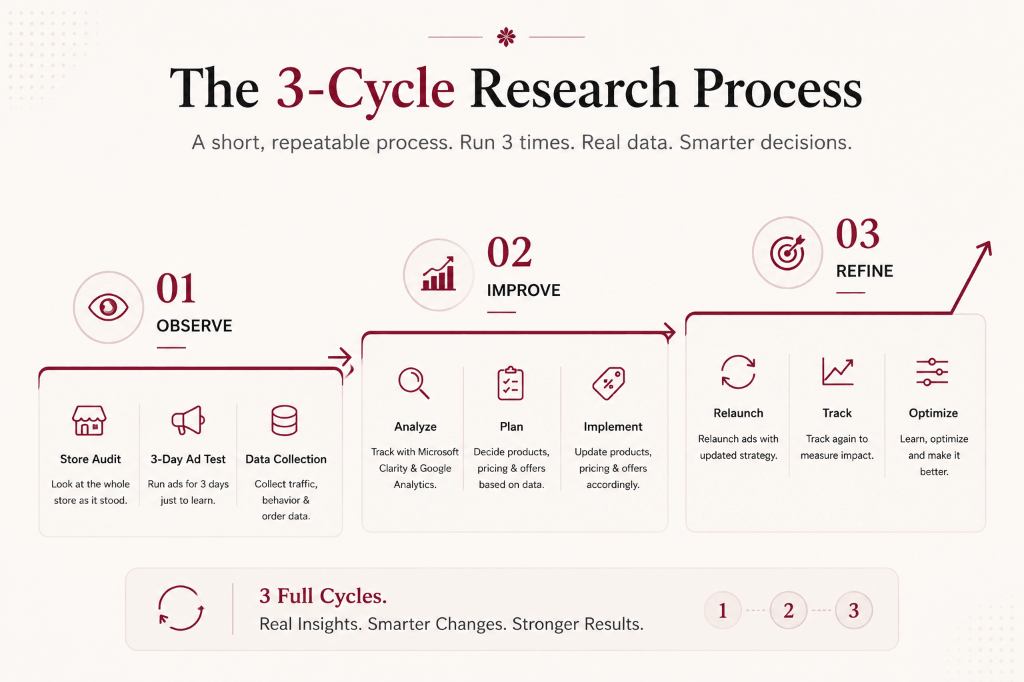
Instead of redesigning the store based on assumptions, the team built a short, repeatable research process — and ran it three full times across the campaign.
Look at the Whole Store First
Before changing anything, the team studied the store as it stood — the site itself, existing analytics, and past order data. This gave a real starting point, not an assumed one.
Run Ads for 3 Days — Just to Learn
Instead of running ads purely to sell, the first move in each cycle was a focused 3-day ad push. The goal wasn't sales yet — it was to bring in enough genuine traffic to observe how real shoppers behaved.
Track Everything with Microsoft Clarity and Google Analytics
During those three days, both tools tracked:
- Which specific rakhi products people were adding to cart, and which they were ignoring
- Where exactly in the shopping journey people were dropping off
- Overall traffic and engagement patterns
This is where the real answers came from — not opinions about which design “should” sell, but actual proof of what was working.
Build a Plan for Products, Pricing, and Offers
Using that data, the team built a clear plan covering:
- Which products deserved more attention, based on what people were actually engaging with
- What pricing made sense for those products
- What specific offers or discounts could nudge interested visitors who hadn't bought yet
Relaunch Ads and Track Again
With updated products, pricing, and offers in place, ads were run again — and the same tracking process repeated, to check whether the changes actually made a difference.
Repeat the Whole Loop
This cycle — research, analyze, plan, relaunch, track — was run three separate times across the campaign, instead of making one round of decisions and hoping it held up for the whole season. Each cycle's data directly shaped the next round of changes.
How Each Round Improved on the Last
What we saw: Visitors were browsing but not buying (very low add-to-cart ratio).
What we did: Ran ads again for 3 days to gather fresh behavioral data and adjust product placement and promotional offers accordingly.
What we saw: People were adding products to cart but abandoning checkout.
What we did: Introduced a simpler, one-click checkout offer via Shiprocket integration to eliminate multi-step friction.
What we saw: Cart abandonment was still present, though improving substantially.
What we did: Refined the one-click checkout offer further and re-tested with another 3-day ad push, locking in conversion gains.
This manual process worked, but it took a lot of time and effort to analyze every cycle by hand. That's what led the team to explore a more automated approach — a central AI-based tool that could pull together data from Google Analytics, Microsoft Clarity, and Shopify's own store and event data, along with other connected apps like cart upsell tools, checkout flows, Shopify Flow automation, and WhatsApp automation — so future cycles could run faster and with less manual effort.
Tools We Used
Each tool in this project had one clear, specific job:
The backbone of the entire research process — tracked session-level behavior, drop-off points, and overall traffic. Every planning decision came from what these tools showed.
Used AI-powered recommendations to increase order value, showing the right cross-sell and upsell offers at the right moment in the shopping journey.
Simplified the checkout process by reducing the number of steps between cart and completed order.
Collected and displayed customer reviews to build trust with new visitors who had no prior experience with the store.
The Results
Across a 3-week campaign window, this process delivered:
Takeaways for Shopify Stores
FAQ
Want a research-driven launch process like this one for your store?
See how a repeatable test-and-adjust loop, paired with the right upsell, checkout, and trust tools, can turn a slow launch into real revenue.